Infographics
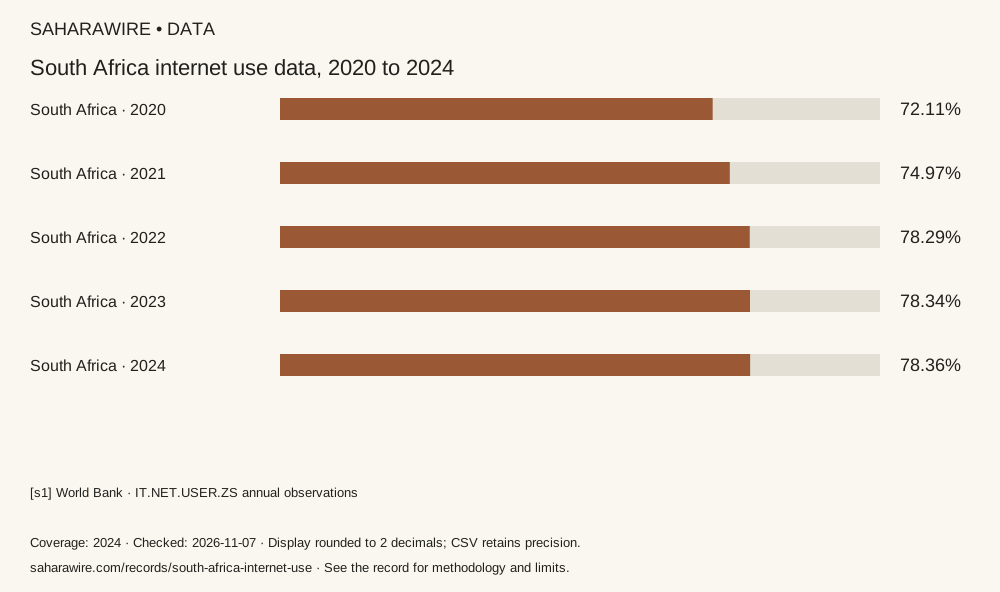
South Africa internet use data, 2020 to 2024
The share of people using the internet, shown over five reported years.
What this record covers
Annual population estimates. These figures do not measure speed, affordability or connection reliability.
Position at the coverage date
The latest displayed observation is for 2024. [s1]
The numbers
% of population · Fixed scale: 0–100. Bar labels rounded to two decimals; table and CSV retain source precision.
| Place / series | Year | % of population | Evidence |
|---|---|---|---|
| South Africa | 2020 | 72.1128006 | [s1] |
| South Africa | 2021 | 74.96859741 | [s1] |
| South Africa | 2022 | 78.29319763 | [s1] |
| South Africa | 2023 | 78.33670044 | [s1] |
| South Africa | 2024 | 78.35759735 | [s1] |
Download data & sources (CSV) Download graphic (SVG)
Method and limits
World Bank indicator IT.NET.USER.ZS. Values keep the precision returned by the API and use a fixed 0 to 100 scale. Missing years are not interpolated. Internet use is distinct from household broadband subscriptions.
Sources & evidence
- [s1] World Bank
Public update history
— First sourced edition. Coverage is limited to the dates stated.
— Titles and explanatory text passed the copywriting and source-consistency checks. Sources and data are unchanged.