Infographics
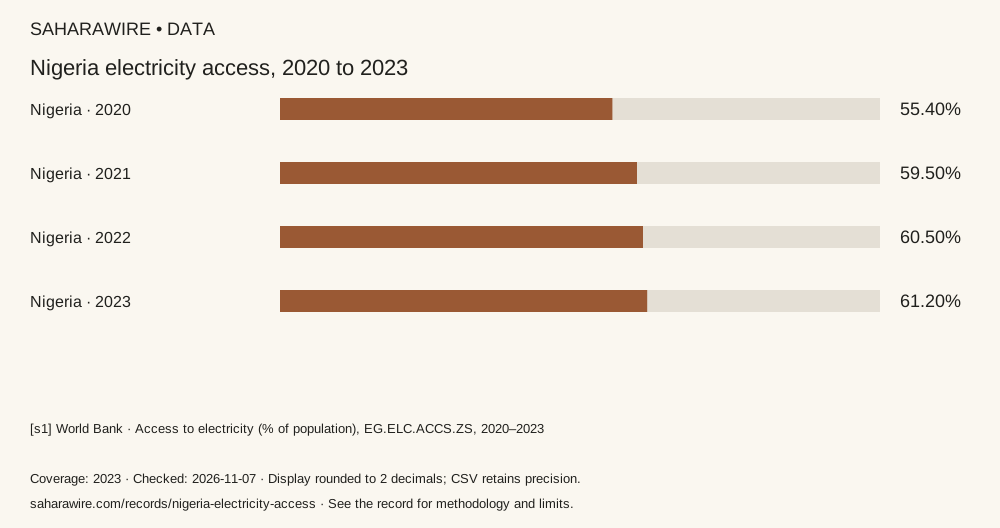
Nigeria electricity access, 2020 to 2023
The share of people with access to electricity, shown for four years.
What this record covers
A historical data snapshot, not a measure of supply reliability or today’s connection rate.
Position at the coverage date
The displayed series ends in 2023. [s1]
The numbers
% of population · Fixed scale: 0–100. Bar labels rounded to two decimals; table and CSV retain source precision.
| Place / series | Year | % of population | Evidence |
|---|---|---|---|
| Nigeria | 2020 | 55.4 | [s1] |
| Nigeria | 2021 | 59.5 | [s1] |
| Nigeria | 2022 | 60.5 | [s1] |
| Nigeria | 2023 | 61.2 | [s1] |
Download data & sources (CSV) Download graphic (SVG)
Method and limits
World Bank indicator EG.ELC.ACCS.ZS reports electricity access, with values kept at API precision and every bar plotted on the same 0 to 100 scale, without measuring hours of supply. No interpolation or missing-value substitution is used. API release metadata: 2026-10-08.
Sources & evidence
Public update history
— First source-linked edition. Coverage is limited to the dates stated above.
— Reviewed titles and explanatory text against the copywriting rules. Source links, dates and data are unchanged.