Infographics
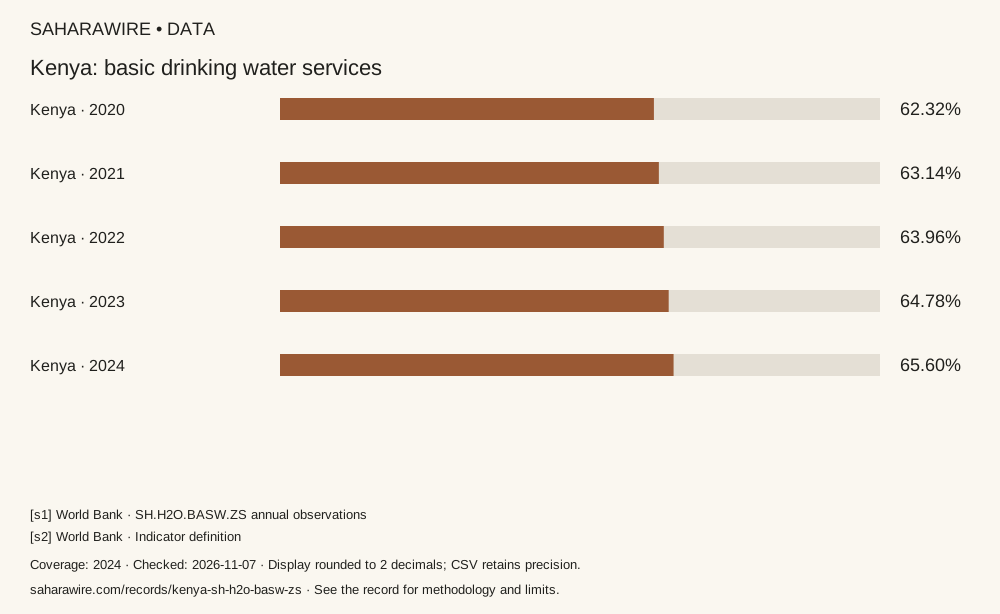
Kenya: basic drinking water services
Reported population shares for 2020, 2021, 2022, 2023, 2024.
What this record covers
World Development Indicators estimates. Coverage follows the cited indicator definition.
Position at the coverage date
The numbers
% of population · Fixed scale: 0–100. Bar labels rounded to two decimals; table and CSV retain source precision.
| Place / series | Year | % of population | Evidence |
|---|---|---|---|
| Kenya | 2020 | 62.318211896262 | [s1] |
| Kenya | 2021 | 63.1426684243247 | [s1] |
| Kenya | 2022 | 63.96426197234 | [s1] |
| Kenya | 2023 | 64.7820788557808 | [s1] |
| Kenya | 2024 | 65.5965968528709 | [s1] |
Download data & sources (CSV) Download graphic (SVG)
Method and limits
World Bank indicator SH.H2O.BASW.ZS. Values retain API precision on a fixed 0 to 100 scale. Missing values are not interpolated.
Sources & evidence
- [s1] World Bank
- [s2] World Bank
Public update history
— First sourced edition. Coverage dates apply.
— Titles and explanatory text passed the copywriting and source-consistency checks. Sources and data are unchanged.