Trackers
Electricity access in Kenya, Nigeria and South Africa compared
A common-year comparison for Kenya, Nigeria and South Africa.
What this record covers
2023 observations only. This is a dated comparison snapshot, not a live service monitor.
Position at the coverage date
The comparison uses 2023 data for all three countries. [s1]
The numbers
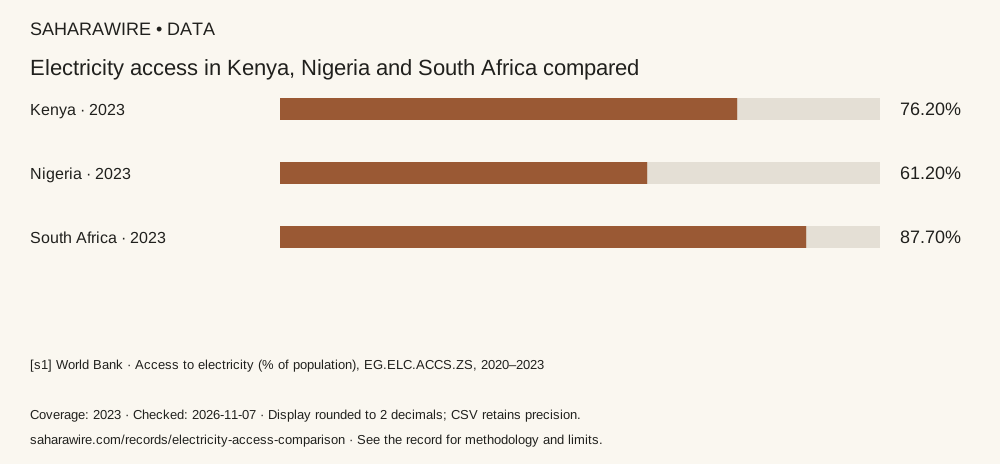
% of population · Fixed scale: 0–100. Bar labels rounded to two decimals; table and CSV retain source precision.
| Place / series | Year | % of population | Evidence |
|---|---|---|---|
| Kenya | 2023 | 76.2 | [s1] |
| Nigeria | 2023 | 61.2 | [s1] |
| South Africa | 2023 | 87.7 | [s1] |
Download data & sources (CSV) Download graphic (SVG)
Method and limits
World Bank indicator EG.ELC.ACCS.ZS provides the figures, with the same indicator, year and unit used for every row and values kept at API precision. It does not measure reliability, price or household consumption. API release metadata: 2026-10-08.
Sources & evidence
Public update history
— First source-linked edition. Coverage is limited to the dates stated above.
— Reviewed titles and explanatory text against the copywriting rules. Source links, dates and data are unchanged.