On Tuesday, September 22, 2026, the Egyptian stock market saw a mixed performance, with some indices rising and others falling. The EGX30 index, which tracks the 30 largest and most liquid stocks, rose by 0.28% to 55,145 points. The EGX30 weighted index, which is a free-float market capitalization-weighted index, increased by 0.31% to 6,865 points. Meanwhile, the EGX30 total return index, which includes dividends and capital gains, gained 0.21% to 25,711 points.
The EGX35-LV index, which tracks the 35 most liquid stocks with low volatility, rose by 0.26% to 6,789 points. The EGX70 equal-weighted index, which tracks the performance of 70 medium and small-sized companies, jumped by 0.88% to 20,659 points. The EGX100 equal-weighted index, which tracks the performance of 100 stocks, increased by 0.72% to 27,193 points. The Islamic Sharia index rose by 0.55% to 6,650 points.
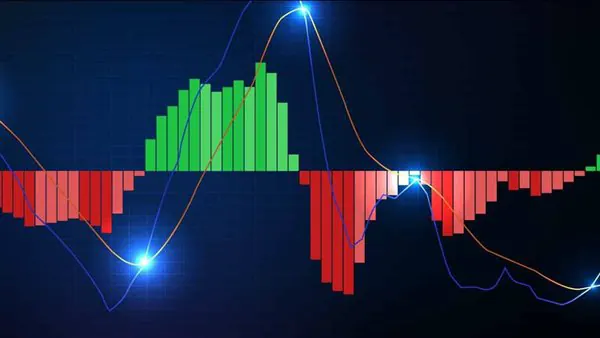
From a technical analysis perspective, the EGX30 index is currently testing the lower bound of an ascending triangle pattern, which is located between 54,000 and 54,500 points. Despite not breaking below this level yet, the index is facing increasing selling pressure, which is reflected in the negative momentum indicators. The Relative Strength Index (RSI) and the Moving Average Convergence Divergence (MACD) indicators are showing negative signals, which confirm the weakness of the momentum.
The EGX70 equal-weighted index, which tracks the performance of medium and small-sized companies, closed below the pivot level of 20,700 points, which indicates a shift from a consolidation phase to a correction phase. The index's failure to break above this level shows that the buying momentum is waning, and the selling pressure is increasing. The Wyckoff analysis of the market's trading activity shows that the market is under selling pressure, with the institutions selling and the individual investors buying.
The market's trading activity reflects the dominance of selling pressure, with the institutions selling and the individual investors buying. This indicates a distribution phase, where the institutions are reducing their positions and the individual investors are absorbing the selling pressure. The market's momentum indicators, such as the RSI, are showing negative signals, which confirm the weakness of the momentum.
The overall market sentiment has shifted from an excessive bullishness to a more defensive behavior. The break below the 20,700 points level is a warning sign, and the 19,800 points level is the main support level. If the market breaks below this level, it could lead to a deeper correction. The market's performance is influenced by the behavior of individual investors and institutions, with the individual investors continuing to buy and the institutions selling.
In conclusion, the Egyptian stock market experienced a mixed performance on Tuesday, with some indices rising and others falling. The market's technical indicators show a weakening momentum, and the trading activity reflects the dominance of selling pressure. The market's overall sentiment has shifted to a more defensive behavior, and the support levels are being closely watched.
Key points
- The EGX30 index rose by 0.28% to 55,145 points.
- The EGX70 equal-weighted index jumped by 0.88% to 20,659 points.
- The market's momentum indicators show a weakening momentum, with the RSI and MACD indicators showing negative signals.